Formula 1 in America: Money, Money, Money — Infographic
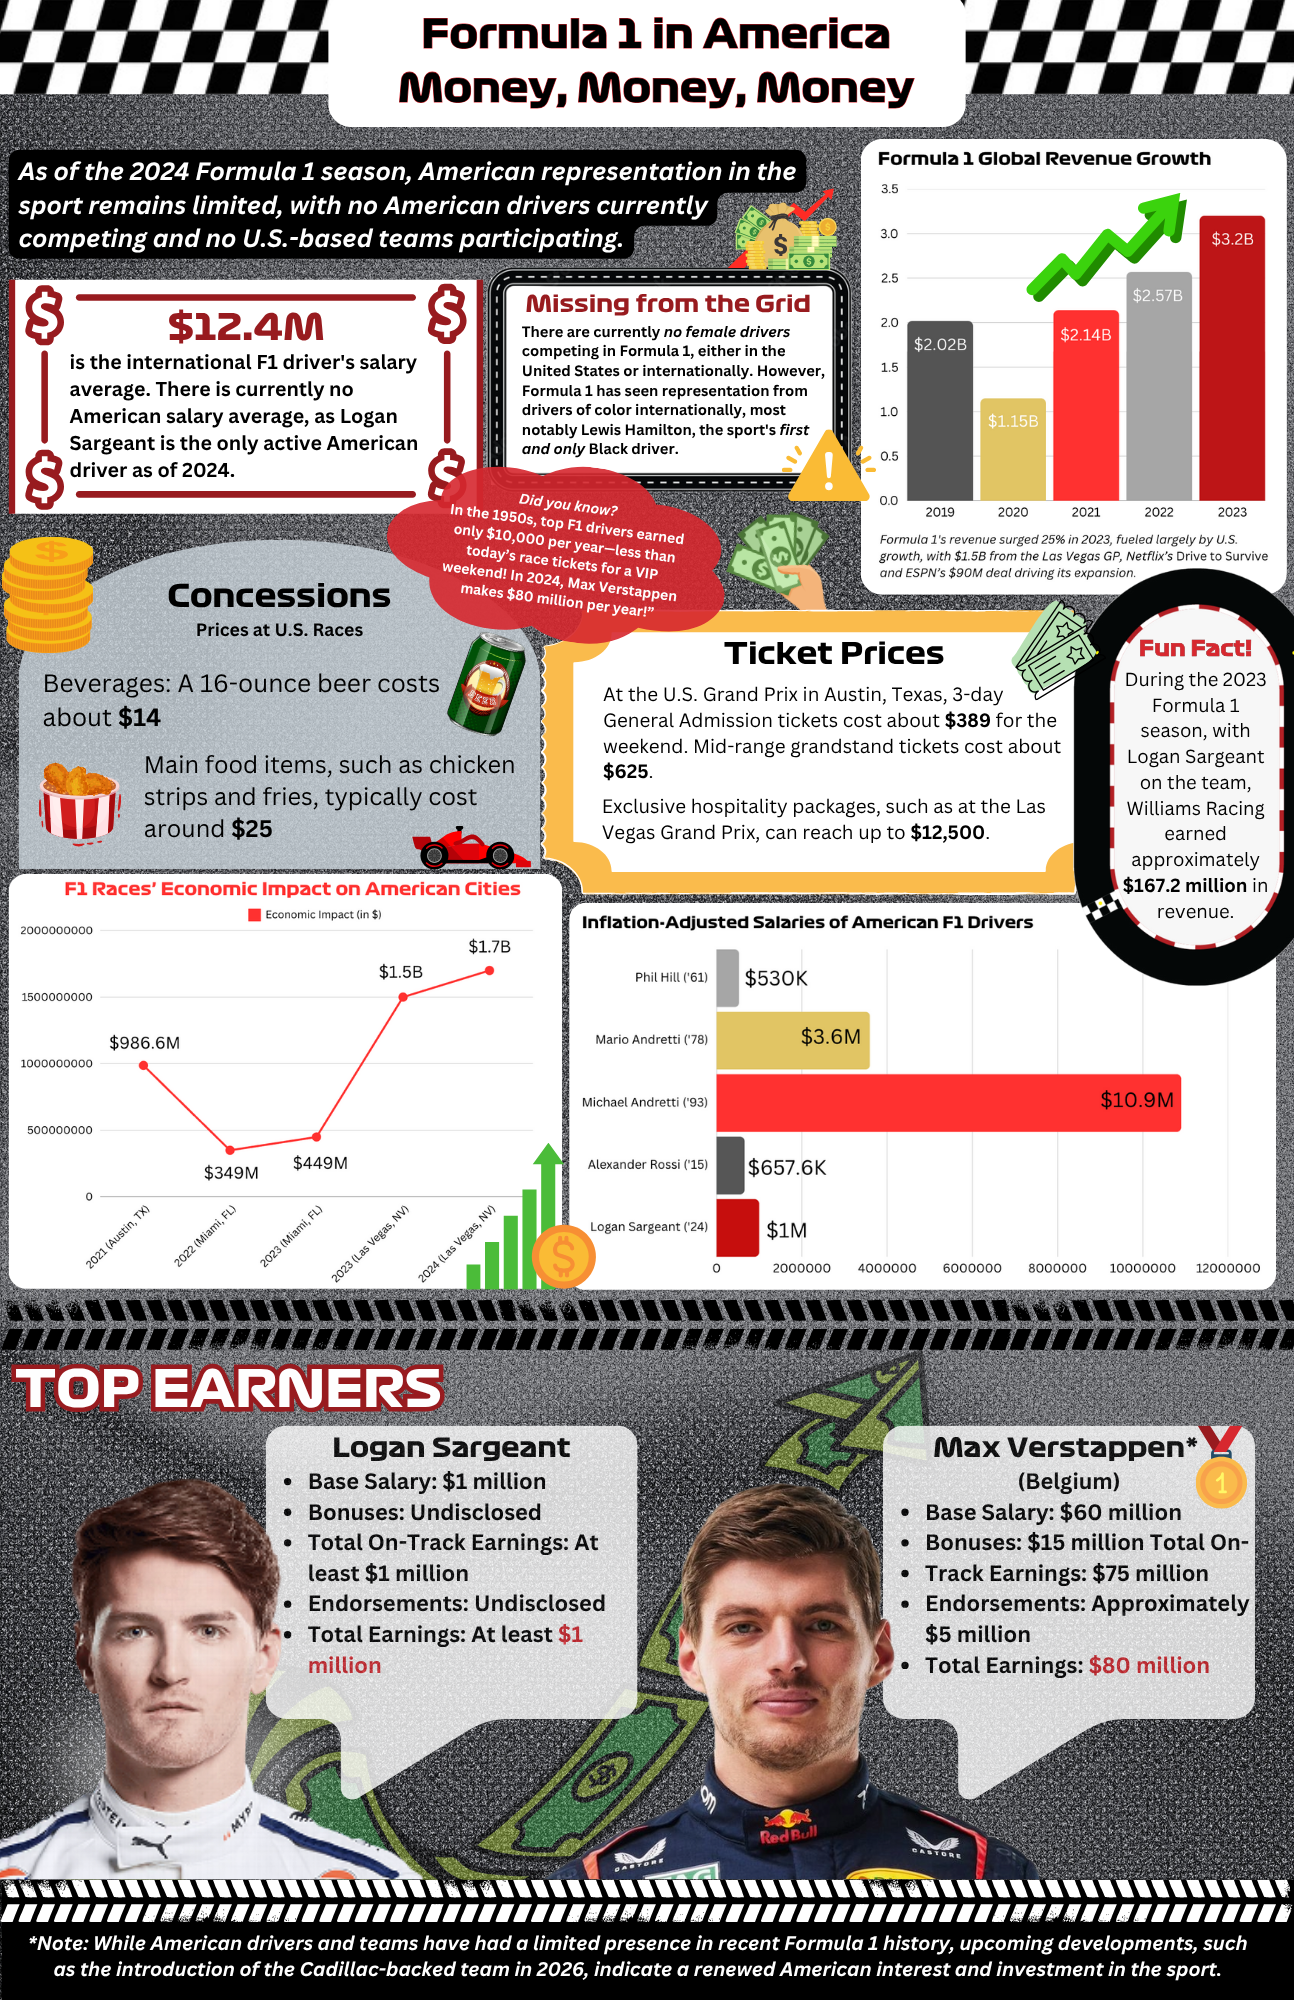
I designed and developed this visually dynamic infographic exploring the financial landscape of Formula 1 in the U.S. market. The piece presents key insights into American representation in the sport, driver salaries, ticket prices, concessions, and the economic impact of races on host cities. It integrates data visualization—such as global revenue growth charts, inflation-adjusted salary comparisons, and economic impact graphs—with engaging facts and statistics, highlighting the stark contrasts between American and international F1 earnings. Designed for clarity and visual appeal, the infographic blends strong typography, thematic graphics, and bold color palettes to make complex financial data accessible and compelling to a broad audience.